
Economic Complexity
We study how productive capabilities shape the paths through which economies learn, diversify, and grow.
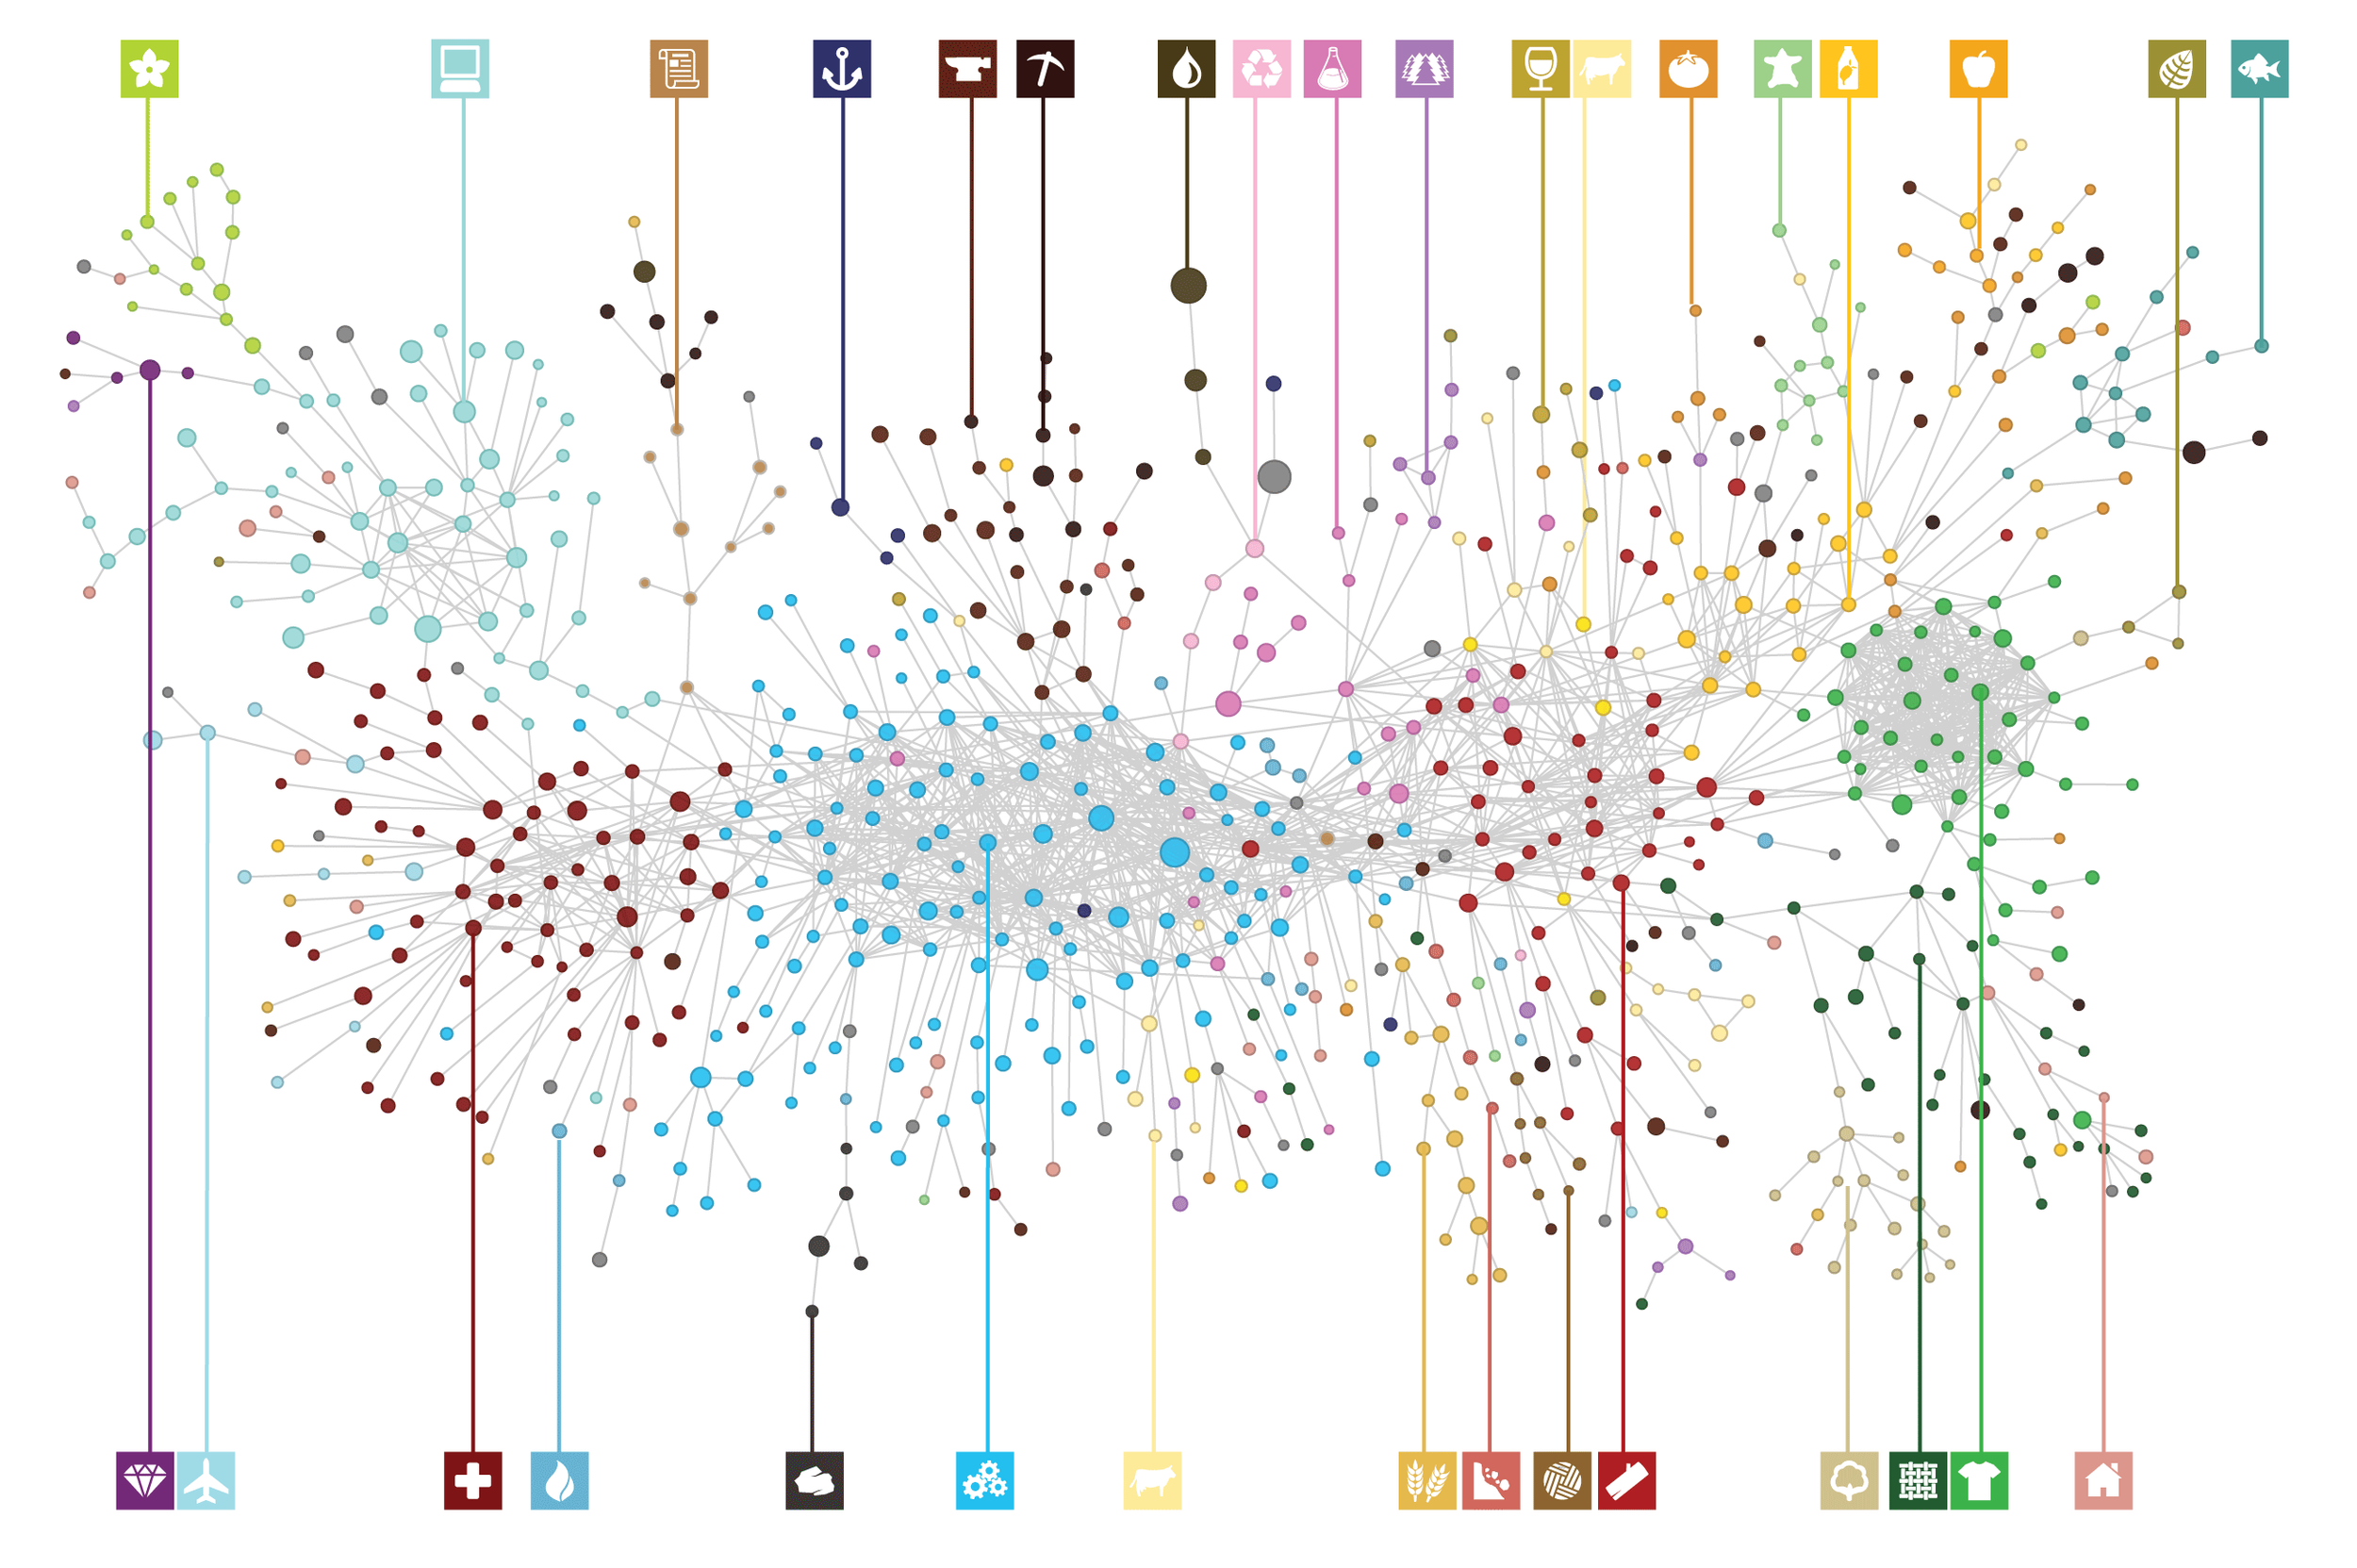
Economies are systems that assemble highly specific and interdependent forms of knowledge and know-how. Yet, incorporating that structure into economic theory and practice has been challenging.
Economic complexity is a rapidly growing field of research that honors the idea that knowledge is fine-grained and non-fungible, and that uses modern mathematical tools to incorporate that reality into economic theory and practice.
Our theoretical work formalizes these ideas by modeling knowledge as a distributed, combinatorial resource. We study how societies accumulate capabilities over time, how those capabilities constrain (and enable) diversification, and combinations of capabilities shape economic structure. By connecting network science, machine learning, and economic theory, economic complexity builds a rigorous foundation for understanding the geography of knowledge, its growth, and implications.
On the empirical side, we develop tools that infer a country’s productive knowledge from its observable outputs that explain long-run growth and diversification trajectories.
Our work also has real-world impact. Economic complexity has become a core component of national development strategies and international policy design. It shapes industrial roadmaps in countries as diverse as Malaysia, where it anchors the New Industrial Master Plan’s top mission, the United Arab Emirates, Rwanda, and Mexico, and many others. Through collaborations with governments, development agencies, and international organizations, we apply our models to guide strategic decisions in trade, innovation, sustainability, and long-term resilience.
For students, postdocs, and faculty, the Center for Collective Learning offers a research environment that blends theory, data, computation, and policy. Our projects range from developing new dynamic models of capability accumulation, to mapping global knowledge networks, to designing AI-driven tools that support evidence-based development. We welcome researchers who want to explore how knowledge structures shape economic outcomes—and who want their work to matter both in academia and in the world.
Economic complexity is ultimately an invitation: to see economies not just as markets, but as collective learning systems. At the CCL, we work to understand those systems—and to help build a future where more places can participate in the knowledge economy.
Flagship Projects and Collaborations

Born in our research team in 2011, The Observatory of Economic Complexity (OEC) is one of the world’s leading trade data visualization platforms. It makes available historical and recent data through dozens of millions of interactive visualizations.
The OEC was developed by Alexander Simoes as part of his requirement to complete his Masters in Media, Arts, and Sciences at MIT between 2010 and 2012.
Books on Economic Complexity
The Infinite Alphabet
Cesar A. Hidalgo
Penguin Random House (2025)
We all understand that knowledge shapes the fate of business and the growth of nations, but few of us are aware of the principles that govern its motion. The Infinite Alphabet unravels the laws describing the growth and diffusion of knowledge by taking you from a failed attempt to build a city of knowledge in Ecuador to the growth of China’s innovation economy.
Why Information Grows
Cesar A. Hidalgo
Basic Books (2015)
What is economic growth? And why, historically, has it occurred in only a few places? Previous efforts to answer these questions have focused on institutions, geography, finances, and psychology. MIT's César Hidalgo, however, took a step back and focused on the evolution of information, and on the ability of people to generate it.
The Atlas of Economic Complexity
Hausmann, Hidalgo, et al.
MIT Press (2014)
Why do some countries grow and others do not? The authors of The Atlas of Economic Complexity offer readers an explanation based on "Economic Complexity," a measure of a society's productive knowledge.
Publications in Economic Complexity
45.-MAPPING GLOBAL VALUE CHAINS AT THE PRODUCT LEVEL
Lea Karbevska, César A. Hidalgo
EPJ Data Science (2025)
Published Version (PDF)
44.-THE DISPARITIES AND DEVELOPMENT TRAJECTORIES OF NATIONS IN ACHIEVING THE SUSTAINABLE DEVELOPMENT GOALS
Fengmei Ma, Heming Wang, Asaf Tzachor, César A. Hidalgo, Heinz Schandl, Yue Zhang, Jingling Zhang, Wei-Qiang Chen, Yanzhi Zhao, Yong-Guan Zhu & Bojie Fu
Nature Communications (2025)
Published Version (PDF)
43.-KNOWLEDGE IS NON-FUNGIBLE
César A. Hidalgo
Chapter in Routledge International Handbook of Complexity Economics (2024)
Published Version (PDF)
42.-AUGMENTING THE AVAILABILITY OF HISTORICAL GDP PER CAPITA ESTIMATES THROUGH MACHINE LEARNING
Philipp Koch, Viktor Stojkoski, César A. Hidalgo
PNAS (2024)
Published Version (PDF)
41.-ESTIMATING DIGITAL PRODUCT TRADE THROUGH CORPORATE REVENUE DATA
Viktor Stojkoski, Philipp Koch, Eva Coll, & César A. Hidalgo
Nature Communications (2024)
Published Version (PDF) | Data Download
40.-INTERCITY CONNECTIVITY AND URBAN INNOVATION
Xiaofan Liang, César A. Hidalgo, Pierre-Alexandre Balland, Siqi Zheng, Jianghao Wang
Computers, Environment and Urban Systems (2024)
Published Version (PDF)
39.-THE ROLE OF IMMIGRANTS, EMIGRANTS AND LOCALS IN THE HISTORICAL FORMATION OF EUROPEAN KNOWLEDGE AGGLOMERATIONS
Philipp Koch, Viktor Stojkoski, and César A. Hidalgo
Regional Studies (2023)
Published Version (PDF)
38.-THE POLICY IMPLICATIONS OF ECONOMIC COMPLEXITY
César A. Hidalgo
Research Policy (2023)
Published Version (PDF)
37.-ACADEMIC MOBILITY AS A DRIVER OF PRODUCTIVITY: A GENDER-CENTRIC APPROACH. IN INTERNATIONAL WORKSHOP ON COMPLEX NETWORKS
Macedo, M., Jaramillo, A. M., & Menezes, R.
International Workshop on Complex Networks 2023
Published Version (PDF)
36.-MULTIDIMENSIONAL ECONOMIC COMPLEXITY AND INCLUSIVE GREEN GROWTH
Viktor Stojkoski, Philipp Koch and César A. Hidalgo
Nature Communications Earth & Environment (2023)
Published Version (PDF)
35.-PATENTS AS INDICATORS OF THE TECHNOLOGICAL POSITION OF COUNTRIES ON A GLOBAL LEVEL?
Loreto Mora-Apablaza and Carlos Navarrete
Scientometrics (2022)
Published Version (PDF)
34.-DO EU REGIONS BENEFIT FROM SMART SPECIALIZATION PRINCIPLES?
David L. Rigby, Christoph Roesler, Dieter Kogler, Ron Boschma and Pierre-Alexandre Balland
Regional Studies (2022)
Published Version (PDF)
33.-THE NEW PARADIGM OF ECONOMIC COMPLEXITY
Pierre-Alexandre Balland et al.
Research Policy (2022)
Published Version (PDF)
32.-MAPPING THE POTENTIALS OF REGIONS IN EUROPE TO CONTRIBUTE TO NEW KNOWLEDGE PRODUCTION IN INDUSTRY 4.0 TECHNOLOGIES
Pierre-Alexandre Balland and Ron Boschma
Regional Studies (2021)
Published Version (PDF)
31.-YET ANOTHER SPACE: WHY THE INDUSTRY SPACE ADDS VALUE TO THE UNDERSTANDING OF STRUCTURAL CHANGE AND ECONOMIC DEVELOPMENT
Philipp Koch and Wolfgang Schwarzbauer
Structural Change and Economic Dynamics (2021)
Published Version (PDF)
30.-THE TIME AND FREQUENCY OF UNRELATED DIVERSIFICATION
Flavio Pinheiro, Dominik Hartmann, Ron Boschma, César A. Hidalgo,
Research Policy (2021)
Published Version (PDF)
29.-SPILLOVERS ACROSS INDUSTRIES AND REGIONS IN CHINA’S REGIONAL ECONOMIC DIVERSIFICATION
Jian Gao, Bogang Jun, Alex “Sandy” Pentland, Tao Zhou, César A. Hidalgo,
Regional Studies (2021)
Published Version (PDF)
28.-ECONOMIC COMPLEXITY THEORY AND APPLICATIONS
César A. Hidalgo,
Nature Review Physics (2021)
Published Version (PDF)
27.-THE AMENITY MIX OF URBAN NEIGHBORHOODS
César A. Hidalgo, Elisa Castañer, Andres Sevtsuk
Habitat International (2020)
Published Version (PDF)
26.-WHEN ALL PRODUCTS ARE DIGITAL: COMPLEXITY AND INTANGIBLE VALUE IN THE ECOSYSTEM OF DIGITIZING FIRMS
Pouya Rahmati, Ali R. Tafti, J. Christopher Westland, César Hidalgo,
Management Information Systems Quarterly (2020)
Published Version (PDF)
25.-COMPUTATIONAL ASPECTS OF OPTIMAL STRATEGIC NETWORK DIFFUSION
Marcin Waniek, Khaled Elbassioni, Flavop L. Pinheiro, César A. Hidalgo, Aamena Alshamsi
Theoretical Computer Science (2020)
Published Version (PDF)
24.-COMPLEX ECONOMIC ACTIVITIES CONCENTRATE ON LARGE CITIES
Pierre-Alexandre Balland, Cristian Jara-Figueroa, Sergio Petralia, Mathieu Steijn, David Rigby, and César A. Hidalgo.
Nature Human Behavior (2020)
Published Version (PDF)
23.-BILATERAL RELATEDNESS: KNOWLEDGE DIFFUSION AND THE EVOLUTION OF BILATERAL TRADE
Bogang Jun, Aamena Alshamsi, Jian Gao, and César A. Hidalgo.
Journal of Evolutionary Economics (2019)
Published Version (PDF)
22.- HOW THE MEDIUM SHAPES THE MESSAGE: PRINTING AND THE RISE OF THE ARTS AND SCIENCES
Cristian Jara-Figueroa, Amy Yu, César A. Hidalgo.
PLoS ONE 14(2): e0205771 (2019)
Published Version (PDF)
21.- THE MOBILITY OF DISPLACED WORKERS: HOW THE LOCAL INDUSTRY MIX AFFECTS JOB SEARCH
FRANK NEFFKE, ANNE OTTO, CESAR A. HIDALGO
Journal of Urban Economics (2018)
Published Version (PDF)
20.-THE ROLE OF INDUSTRY-SPECIFIC, OCCUPATION-SPECIFIC, AND LOCATION-SPECIFIC KNOWLEDGE IN THE GROWTH AND SURVIVAL OF NEW FIRMS
CRISTIAN JARA-FIGUEROA, BOGANG JUN, EDWARD GLAESER, & CÉSAR A. HIDALGO,
Proceedings of the National Academies of Sciences, 115 (50) 12646-12653 (2018)
NBER Working Paper, Published Version (PDF)
19.-THE PRINCIPLE OF RELATEDNESS
CÉSAR A. HIDALGO, PIERRE-ALEXANDRE BALLAND, RON BOSCHMA, MERCEDES DELGADO, MARYANN FELDMAN, KOEN FRENKEN, EDWARD GLAESER, CANFEI HE, DIETER F. KOGLER, ANDREA MORRISON, FRANK NEFFKE, DAVID RIGBY, SCOTT STERN, SIQI ZHENG, SHENGJUN ZHU
ICCS 2018: Unifying Themes in Complex Systems IX pp 451-457 (2018)
Published Version (PDF)
18.-UNPACKING THE POLARIZATION OF WORKPLACE SKILLS
ALABDULKAREEM, AHMAD, MORGAN R. FRANK, LIJUN SUN, BEDOOR ALSHEBLI, CESAR HIDALGO, and IYAD RAHWAN
Science Advances 4, no. 7 (2018)
Published Version (PDF)
17.-OPTIMAL DIVERSIFICATION STRATEGIES IN THE NETWORKS OF RELATED PRODUCTS AND RELATED RESEARCH AREAS
AAMENA ALSHAMSI, FLAVIO PINHEIRO, CESAR A. HIDALGO
Nature Communications 9:1328 (2018)
Published Version (PDF)
16.-ECONOMIC COMPLEXITY: FROM USELESS TO KEYSTONE
CESAR A. HIDALGO
Nature Physics 14(1), 9 (2018)
Published Version (PDF)
15. INEQUALITY IN LATIN AMERICA AND ASIA
DOMINIK HARTMANN, CRISTIAN JARA-FIGUEROA, MIGUEL GUEVARA, ALEX SIMOES, CÉSAR A. HIDALGO
Revista Integración & Comercio: No. 40: Junio (2016)
Published Version (PDF) [Spanish | English]
14. THE RESEARCH SPACE: USING CAREER PATHS TO PREDICT THE EVOLUTION OF THE RESEARCH OUTPUT OF INDIVIDUALS, INSTITUTIONS, AND NATIONS
MIGUEL GUEVARA, DOMINIK HARTMANN, MANUEL ARISTARAN, MARCELO MENDOZA, CÉSAR A. HIDALGO
Scientometrics, Volume 109, Issue 3, pp 1695–1709 (2016)
Published Version (PDF)
13. UNDER THE HOOD--THE COMPUTATIONAL ENGINE OF ECONOMIC DEVELOPMENT
CÉSAR A. HIDALGO
Chapter in: "To the Man with a Hammer" Verlag Berlsmannstiftung (2016)
Medium | Amazon (Book Chapter)
12. NEIGHBORS AND THE EVOLUTION OF THE COMPARATIVE ADVANTAGE OF NATIONS: EVIDENCE OF INTERNATIONAL KNOWLEDGE DIFFUSION?
DANY BAHAR, RICARDO HAUSMANN, AND CÉSAR A. HIDALGO
Journal of International Economics. 92(1) 111-123
Published Version (PDF)
11. THE STRUCTURE AND DYNAMICS OF INTERNATIONAL DEVELOPMENT ASSISTANCE
MICHELE COSCIA, RICARDO HAUSMAN, AND CÉSAR A. HIDALGO
Journal of Globalization and Development (March 2013) DOI 10.1515/jgd-2012-0004
Published Version (PDF)
10. PROTO-GENES AND DE NOVO GENE BIRTH
ANNE-RUXANDRA CARVUNIS ET AL.
Nature (2012) DOI 10.1038/nature11184
Published Version (PDF)
PRESS: Faculty of 1000 | Green Fluorescent Blog | Beast Bard and Bot | Biobabel | Science Alerts
9. THE DYNAMICS OF NESTEDNESS PREDICTS THE INDUSTRIAL DEVELOPMENT OF NATIONS
SEBASTIAN BUSTOS, CHARLES GOMEZ, RICARDO HAUSMANN, AND CÉSAR A. HIDALGO
PLoS One 7(11): e49393. DOI 10.1371/journal.pone.0049393 (2012)
Published Version (PDF)
PRESS: Phys.org
8. THE ECONOMIC COMPLEXITY OBSERVATORY: AN ANALYTICAL TOOL FOR UNDERSTANDING THE DYNAMICS OF ECONOMIC DEVELOPMENT
ALEX SIMOES, CÉSAR A. HIDALGO
Scalable Integration of Analytics and Visualization (2011)
Published Version (PDF)
7. THE NETWORK STRUCTURE OF ECONOMIC OUTPUT
RICARDO HAUSMANN AND CÉSAR A. HIDALGO
Journal of Economic Growth 16:309-342 (2011)
Published Version (PDF)
6. DISCOVERING SOUTHERN AND EAST AFRICA'S INDUSTRIAL OPPORTUNITIES
CÉSAR A. HIDALGO
German Marshall Fund Economic Policy Series, (2011)
Published Version (PDF)
5. THE DYNAMICS OF ECONOMIC COMPLEXITY AND THE PRODUCT SPACE OVER A 42 YEAR PERIOD
CÉSAR A. HIDALGO
CID Working Paper 189 (2009)
Published Version (PDF)
4. THE BUILDING BLOCKS OF ECONOMIC COMPLEXITY
CÉSAR A. HIDALGO, RICARDO HAUSMANN
Proc. Natl. Acad. Sci. (2009) 106(26):10570-10575
Published Version (PDF)
PRESS: The Economist | Harvard Magazine | Indian Express | Boston.com | La Prensa | financenews.sina.com | fapesp | Impact | Harvard Kennedy School | PhysOrg | Planeta Universitario | The Financial Times | Ceticismo | Christian Science Monitor
3. A NETWORK VIEW OF ECONOMIC DEVELOPMENT
CÉSAR A. HIDALGO, RICARDO HAUSMANN
Developing Alternatives (2008) 12(1): 5-10
Published Version (PDF)
2. THE PRODUCT SPACE CONDITIONS THE DEVELOPMENT OF NATIONS
CÉSAR A HIDALGO, BAILEY KLINGER, ALBERT-LÁSZLÓ BARABÁSI, RICARDO HAUSMANN
Science (2007) 317: 482-487
Published Version (PDF)
PRESS: The Financial Times | The Slate | La Razon | Science News | Webmanagercenter | Physorg | BNET | Xaluan | Saigon Times | Cotidanul | Rue 89 | Bank News | Business in Development | Infosthetics | Visual Complexity | Trinidad Express | Nha Buon | Harvard Magazine
1. TRANSCRIPTION FACTOR MODULARITY IN A GENE-CENTERED C. ELEGANS PRTEIN-DNA INTERACTION NETWORK
V VERMEIRSSEN, MI BARRASA, CA HIDALGO, JAB BABON, R SEQUERRA, L DOUCETTE-STAMM, A-L BARABÁSI, AJM WALHOUT
Genome Res. (2007) 17:1061-1071
Published Version (PDF)